SafeFuture Lab — evidence, verified · agent portal

Same hill, same limit — one has a camera.
Drivers choose very different speeds.

NSW fixed speed cameras × connected-vehicle Operating Speed data (June 2026) × matched-grade controls. Descriptive speed association — not a crash or causal study.

Flat Rock Dr — no camera 6.1% grade
p85 76
steepest section, 60 zone — tail 16 over; medians up to 68
Eastern Arterial — camera 6.2% grade
p85 58
whole distribution under the same 60 limit
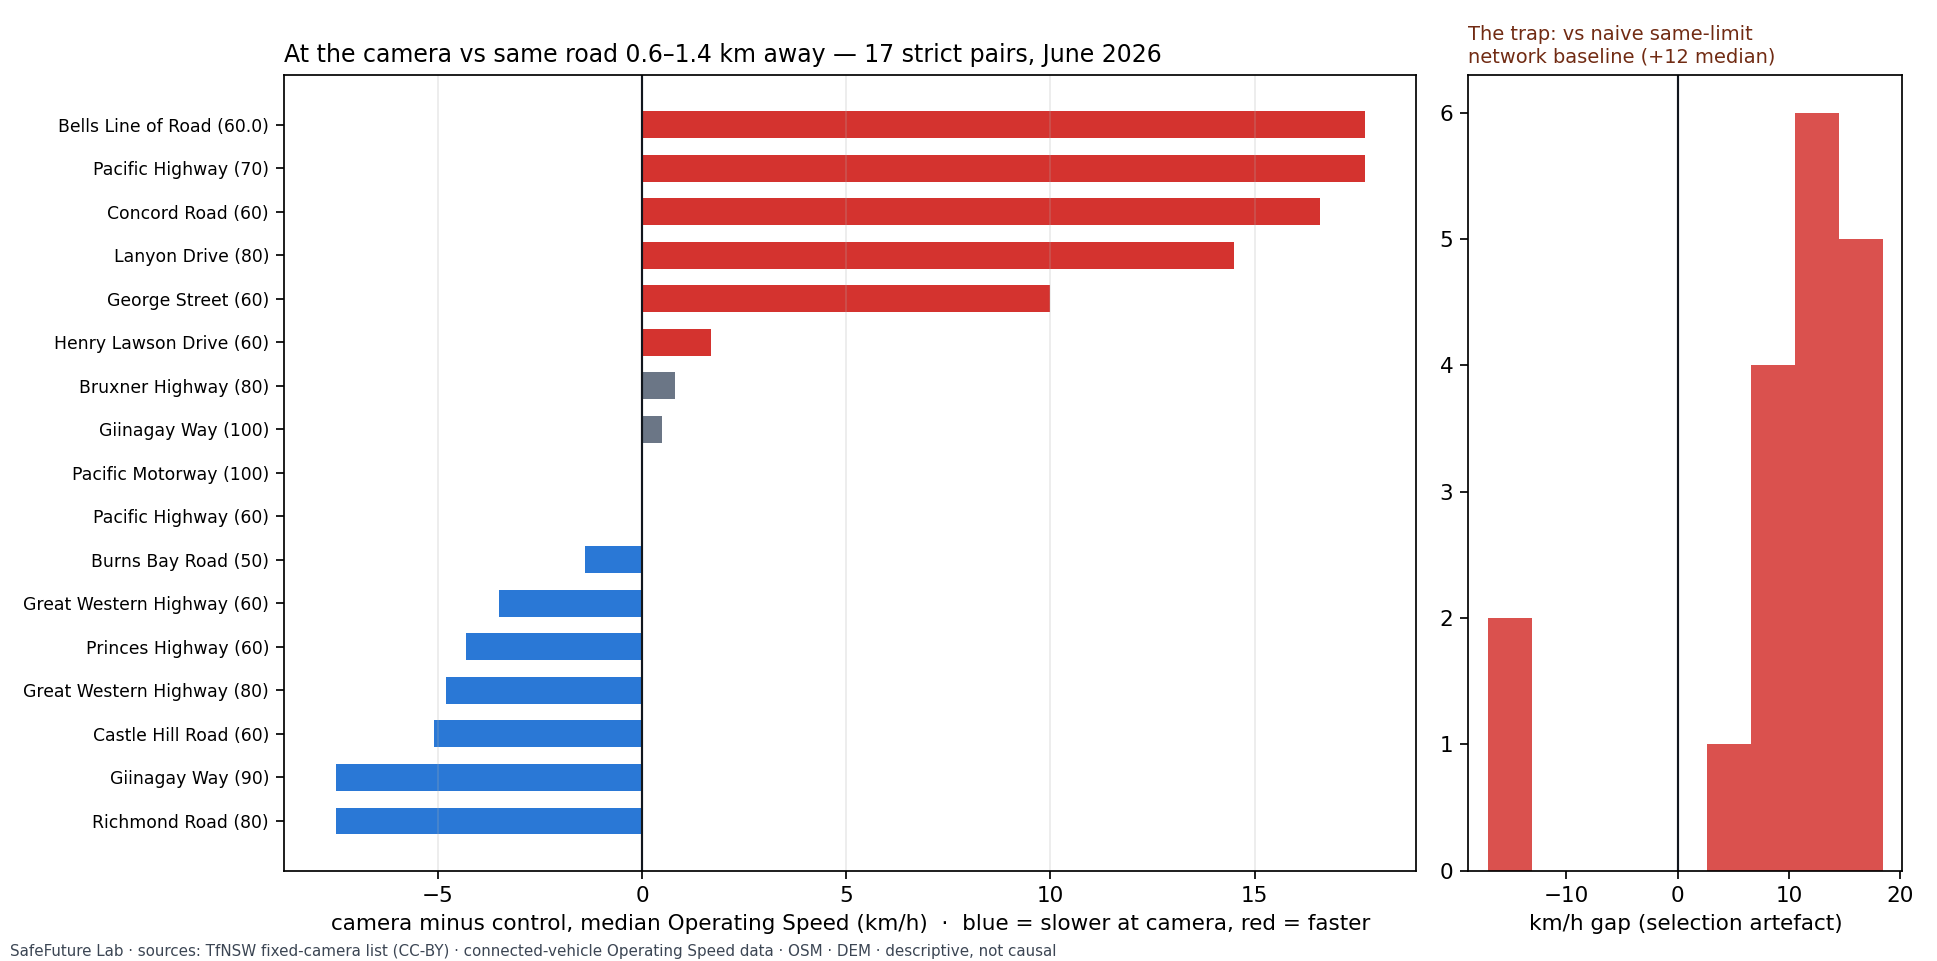
At-camera point dip 17 strict pairs
+0.0
median gap vs same road 1 km away — corridors are uniform
The naive-baseline trap exhibit
+12
selection artefact, published as a warning — not an effect

Where there's no #Camera, gravity wins!

What a 6% hill does to speed compliance - and what one camera changes.

Two Sydney hills. Both ~6% grade. Both 60 km/h zones. One has a fixed #speed_camera.

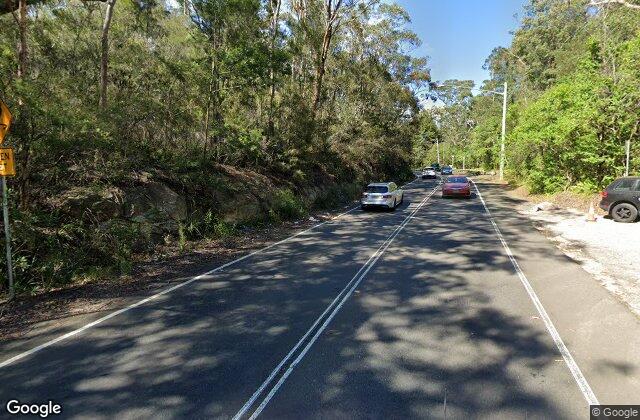
On Eastern Arterial Road (camera, Gordon): 85th-percentile operating speed 55-58 km/h. The whole distribution sits UNDER the limit - on a 6% descent.

On Flat Rock Drive (no camera, Naremburn-Northbridge): p85 61-63 along the road, but on the steepest section the tail hits 76 with medians around 68 - in month-aggregated #Operating_Speed data that smooths peaks (spot speeds run higher).

Same geometry. Same limit. The difference is what #road_users get away with.

This is a descriptive matched pair, not a causal study - and the wider picture is consistent: across 17 strict same-road camera/control pairs we find NO localised dip at cameras (median gap +0.0 km/h). Corridors with cameras read uniformly paced; steep corridors without them grow a fat, fast tail downhill.

Interactive evidence, imagery, the bias register, and an agent that only answers what it can verify: https://enforcement.crashstats.com.au

#RoadSafety #DriverBehaviour #SpeedManagement #SpeedCameras #OperatingSpeed #VisionZero #SafeFutureLab #AI_Agent
The matched-grade pair mart_extreme_pair · Operating Speed data · Jun-26 · OSM · DEM

sitecameragradelimitmedianp85 (tail)
Flat Rock Drive, Naremburn→Northbridge (steepest section)no~6.1%606876
Flat Rock Drive (whole road, by direction)no~6.1%6047–5461–63
Eastern Arterial Rd, Gordon (camera between Koola & Nicholson)yes~6.2%6049–5255–58

Month-aggregated connected-vehicle tiles; edge aggregation damps peaks — individual observed speeds on Flat Rock Drive exceed these values. Descriptive comparison of one matched pair; it cannot by itself attribute cause.

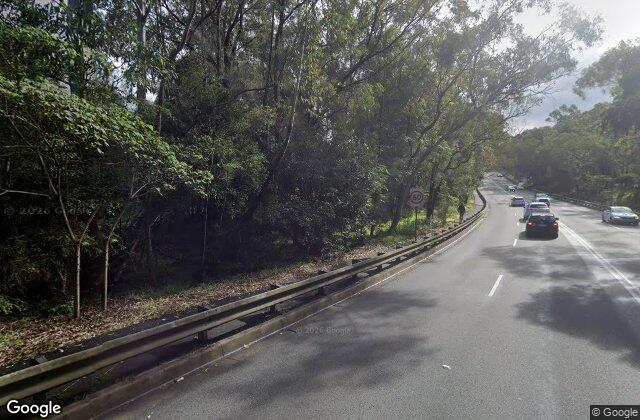
Street View — Flat Rock Drive descent
Flat Rock Drive — the no-camera descent (Google Street View)
Street View — Eastern Arterial Road descent
Eastern Arterial Rd — the camera hill (Google Street View)
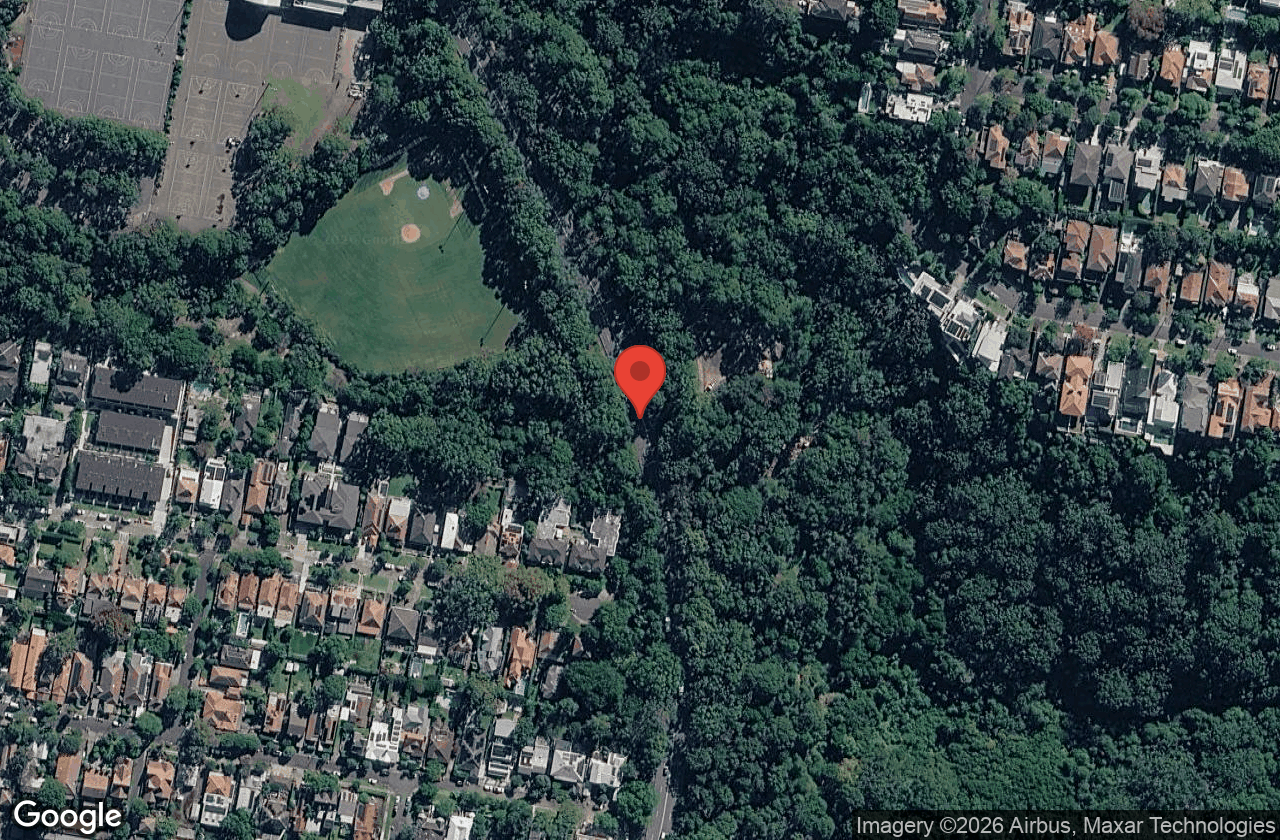
Satellite — Flat Rock Drive
Flat Rock Dr — satellite (red = steepest section)
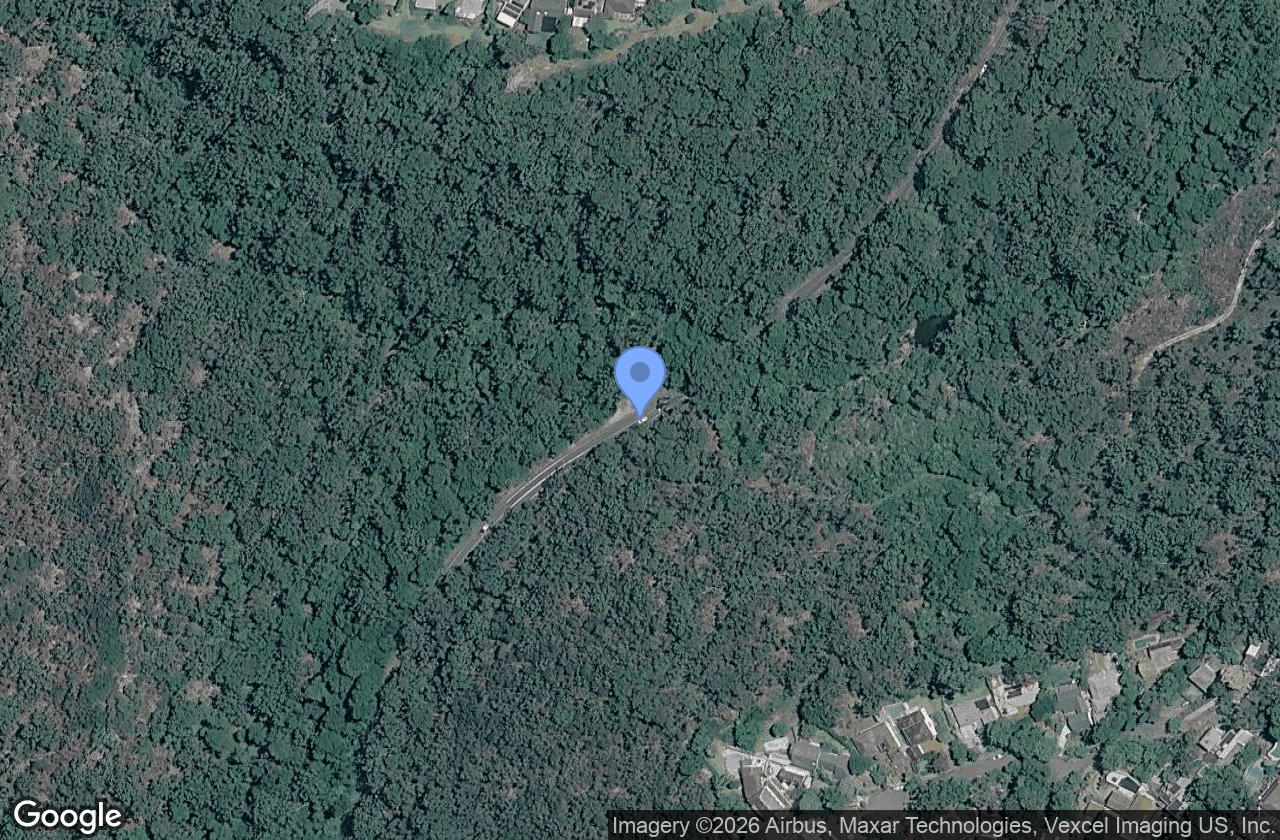
Satellite — Eastern Arterial Road
Eastern Arterial Rd — satellite (blue = camera zone)

Hilly vs flat corridors mart_hills

Across all paired sites, gap-to-limit (median minus posted limit) by corridor grade, camera chain vs control chain — the hill effect and the camera association, separated. Ask the agent for the current numbers; it reads them live from the marts.

What we did NOT find mart_summary_e1

No at-camera point dip: across 17 strict same-road pairs the median gap camera-vs-1-km-away is +0.0 km/h (camera side slower at 7/17). Speeds are corridor-uniform near NSW fixed cameras — no slam-brake-and-surge signature in month-aggregated data.

The trap we refused mart_baseline_e2 · exhibit

Against a naive same-limit network baseline, camera corridors look +12 km/h faster — pure placement selection (cameras sit on high-standard arterials). Published as a warning, never as an effect.

Per-pair gaps and selection-artefact histogram

Gates — what survived mart_attrition

stagenrule
TfNSW fixed-camera list123open data (CC-BY)
GPS-locatable103coordinates parseable
paired60CV features ≤200 m + control band 0.6–1.4 km
non-school-zone41time-variable limits excluded
strict same-road pairs17identical road + limit, grade-similar

Ask the evidence

Answers are planned as SQL on the marts, machine-verified, refused when unverifiable — the same 5-rule manifesto as ask.crashstats.com.au. Causal and crash claims are blocked by the verifier.

Independence & bias. Published by Sabour Khosravi, SafeFuture Lab. Sabour contributes to Road Safety Victoria’s data work — a disclosed bias, mitigated by the published bias register and open data only. Independent of TfNSW and all governments. Educational analysis, never engineering or policy advice.

Report nsw-speed-enforcement-2026-06 · · More agents: ask.crashstats.com.au
Speed Enforcement Effect AI Assistant
Answers only from this report's data — every number machine-verified before display.
G'day — ask me about this analysis: camera-vs-control gaps, the hilly-pair case study, the selection artefact, attrition, methods. I refuse what I can't verify.
Educational report assistant by Sabour Khosravi (SafeFuture Lab). Independent of TfNSW and all governments. Not engineering advice. Questions may be reviewed to improve accuracy.